
How to Look Up McLennan County Jail Population Data
Texas counties send jail population reports to TCJS every month. The agency posts those reports as county-level PDFs on its site. The county population reports page is the right starting point for McLennan County totals. The page is grouped by month and includes both raw counts and capacity context.
The data live at the TCJS county population reports site, which lists monthly reports and supporting documents.
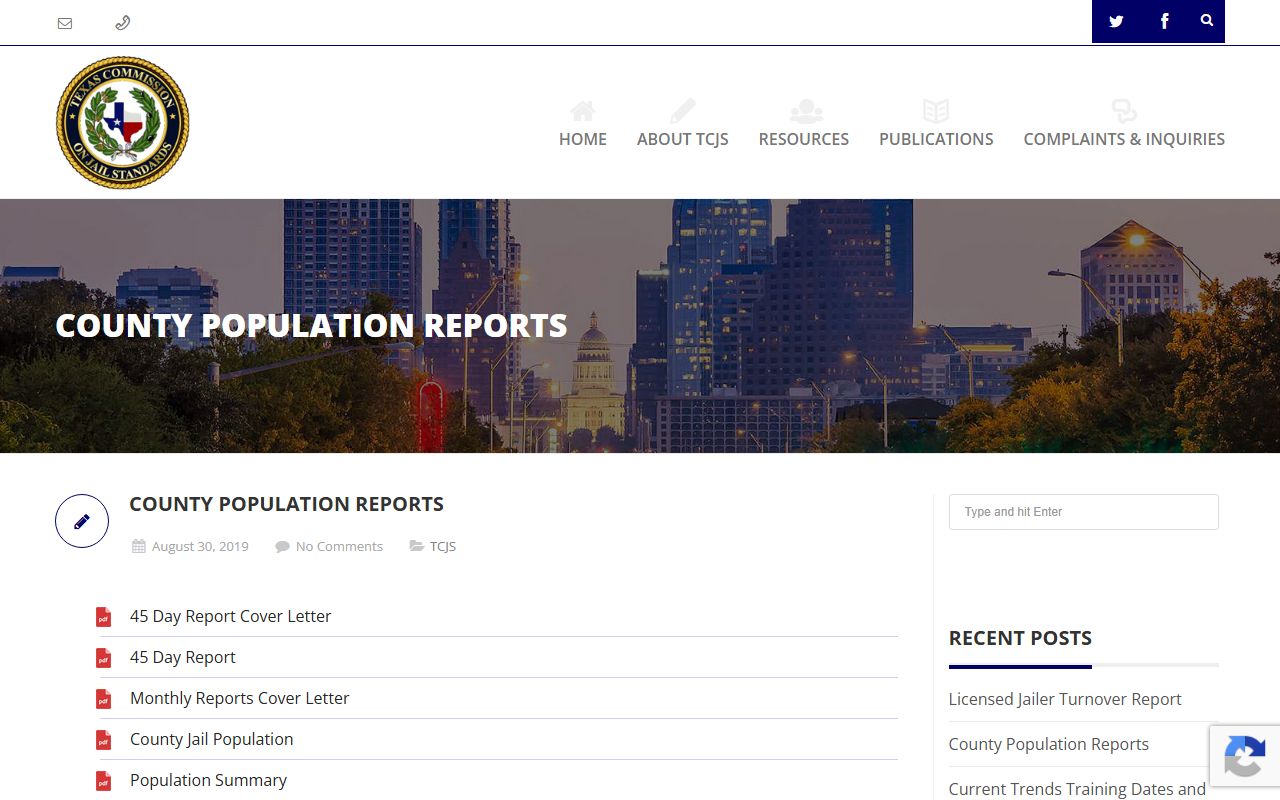
TCJS publishes monthly reports for each county and posts the Population Summary, raw counts, capacity, and supporting reporting documents at tcjs.state.tx.us.
McLennan County Jail Capacity Overview
The Sheriff runs the main county jail on State Highway 6. Jack Harwell Detention Center sits on East Marlin Highway in Waco and has been used as additional detention space. The county pages do not publish current capacity directly, and TCJS posts the official capacity numbers in its monthly reports. Confirm the current figure with the latest TCJS Population Summary for McLennan County before quoting any number as official.
| Facility | Address | Phone |
|---|---|---|
| McLennan County Jail (Hwy 6) | 3201 E. State Highway 6, Waco, TX 76705 | 254-757-2555 |
| Jack Harwell Detention Center | 3101 E. Marlin Highway, Waco, TX 76705 | Confirm with Sheriff's Office |
| Bill Logue Juvenile Justice Center | Confirm with the county | Juvenile Records 254-757-5072 |
Average Daily Population
Average daily population, or ADP, is the typical number of people in custody on a given day across the month. TCJS computes this for every county from the same daily counts the county is required to submit. ADP is a better gauge than a single snapshot, because daily totals swing with weekend bookings and large court settings. The TCJS Population Summary is the place to read the McLennan County ADP for the current month.
Compare ADP to capacity to see how tight things are. A county at 80 percent of capacity has room to absorb a spike. A county at 95 percent or above has little slack. The TCJS report shows both numbers side by side, which makes the percentage easy to compute. Some counties also contract beds out to or in from other counties, and those flows appear in the TCJS categories.
Demographic Breakdown
The Sheriff Mugshots app shows individual demographic fields per booking, such as race, ethnicity, sex, age, height, weight, hair, and eyes. TCJS reports aggregate the wider picture. Together the two layers can sketch a demographic profile, but the public mugshot data alone is a snapshot of recent bookings, not the full custody population. Always cite the TCJS report when claiming a McLennan County breakdown.
Aggregate breakdowns usually cover male and female totals, and split categories such as pretrial, sentenced, contract, and federal holds. The TCJS report does not publish race-by-charge cross-tabs at the level of detail some researchers want. Outside groups such as the Vera Institute publish county trend PDFs for context, though those are research products and not official county numbers. Always label which source a number comes from.
Demographic counts can shift quickly when court dockets clear or when a major arrest sweep happens. A single weekend operation can move the demographics on the mugshot side without changing the TCJS monthly total by much, since the monthly figure averages across thirty days. Both layers tell the truth, but they tell different parts of it.
Pretrial vs. Sentenced Population
One of the most important splits in jail data is pretrial versus sentenced. A pretrial inmate is held before trial, often because of bond. A sentenced inmate is serving time after a conviction. TCJS reports break the population into pretrial Class C misdemeanor, pretrial Class A and B misdemeanor, pretrial felony, convicted misdemeanor, felony offenders reduced to misdemeanor, convicted felony, bench warrants, and federal or contract categories.
For McLennan County, the 474th District Court is the designated juvenile court and the referring court for CPS de novo review, which can affect how some juvenile counts route. The 474th page is on the county site.
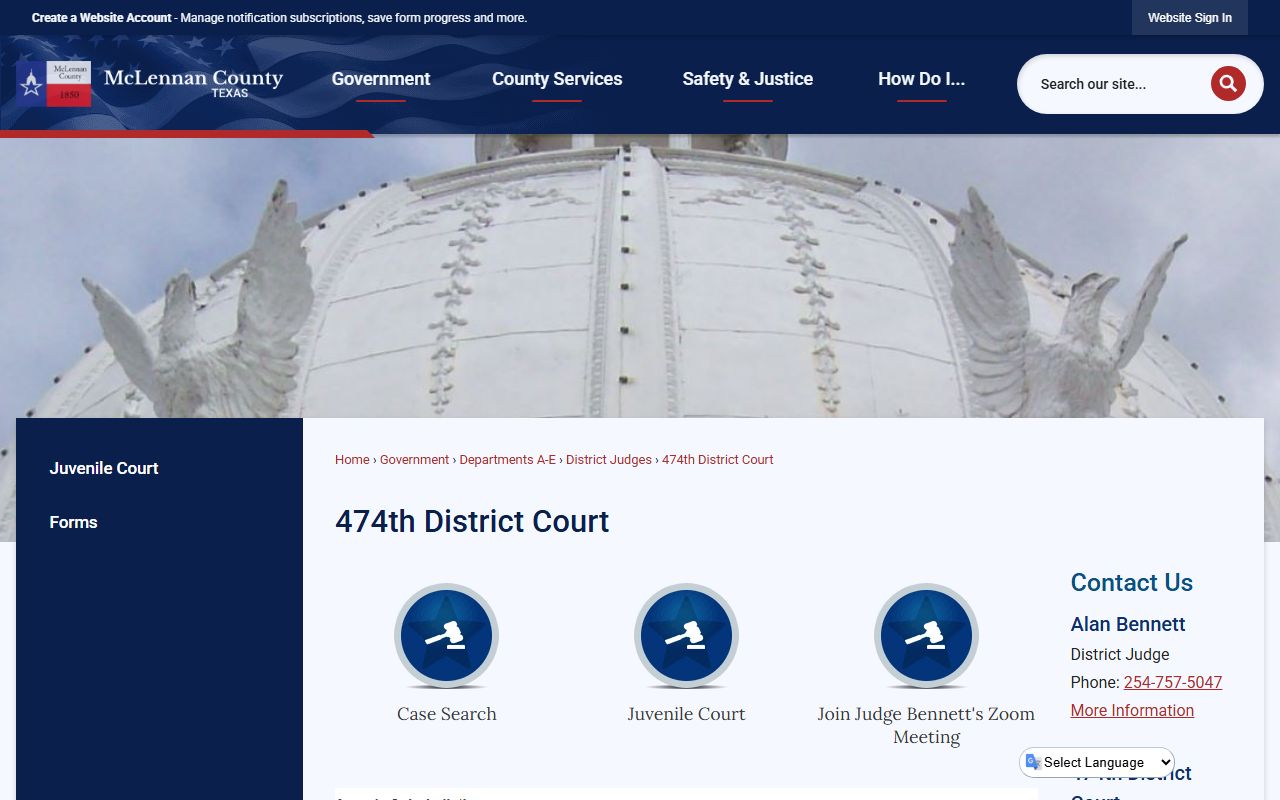
The 474th page explains the court's civil and family work and the juvenile designation that touches the inmate population counts for younger defendants.
| Category | What It Means |
|---|---|
| Pretrial felony | Felony charge, no conviction yet, held in county custody. |
| Pretrial misdemeanor | Misdemeanor charge, no conviction yet, often Class A or B. |
| Convicted misdemeanor | Serving misdemeanor time after a guilty finding. |
| Convicted felony | Sentenced and awaiting state transfer or in local custody. |
| Bench warrant / federal / contract | Holds for outside agencies or returns. |
Misdemeanor vs. Felony Population
The misdemeanor and felony split shapes how the county uses its space. Felony cases run through the District Clerk and the 19th and 54th District Courts. Misdemeanor cases run through the County Clerk and the County Courts at Law. People held in county custody can be on either side. Misdemeanor holds usually move out faster, while felony holds can sit longer pending grand jury and pretrial settings.
Mental Health and Medical Population
Mental-health and medical needs in jail are tracked separately from the headline counts. McLennan County's Mental Health Treatment Court takes a small slice of qualifying defendants with serious diagnoses such as psychotic disorder, bipolar disorder, major depressive disorder, or schizophrenia. The county Specialty Courts page describes the eligibility standard. TCJS reports also break out mental-health and medical categories where the county records them.
National and State Context
Texas Government Code section 511.0101 is the legal basis for monthly jail population reporting. Counties have to send the data to TCJS, which compiles it. The federal Bureau of Justice Statistics also publishes county-level rates per 100,000 residents for cross-county comparison.
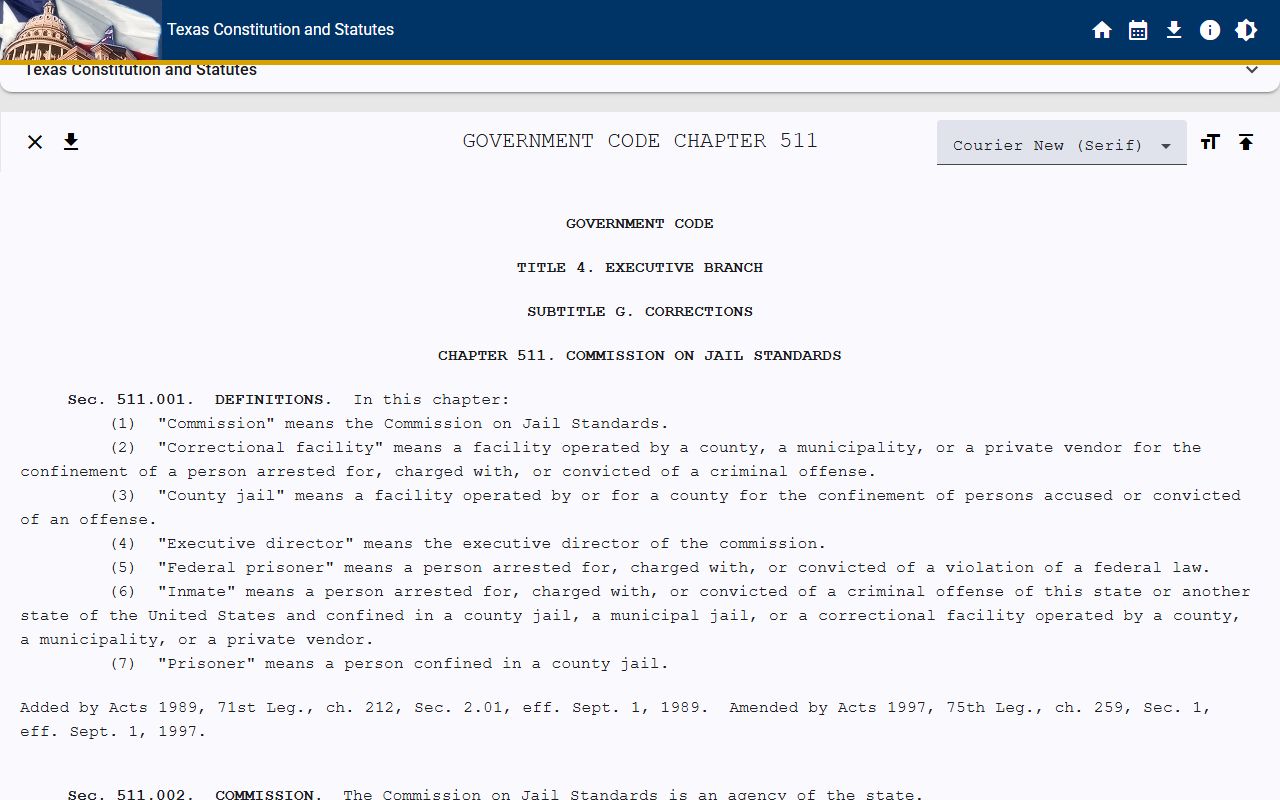
Section 511.0101 requires counties to submit monthly jail population data to the Texas Commission on Jail Standards. Read the statute at capitol.texas.gov.
Comparing McLennan County to state and national rates needs care. Population, charging policy, bond practice, and court capacity all affect the local rate. Use BJS rates and TCJS county data side by side. Always show the source and the year for each number.
Population Trends Over Time
Trends matter more than a single month. Pull the TCJS Population Summary for McLennan County over the last five years, then compare ADP and pretrial share against capacity. A rising pretrial share with flat capacity tends to signal bond and docket pressure, not necessarily more crime. The county's budget office publishes annual budgets that show jail and jail-medical staffing levels, which provide more context for the population data.
The FY 2026 county budget posts jail and jail-medical salary lines on the budget office page, with a night-shift differential noted in the jail medical section. Staffing levels can drive how the county manages its capacity, since unstaffed beds count against the usable count. A high pretrial share also tends to push the county to use contract beds at other facilities, which adds cost and shifts where some people serve their time. None of those moves are visible in the mugshot data, but TCJS reports capture the totals.
Compare McLennan County to similar Texas counties of close population to put a number in context. A county with a larger ADP may simply be larger, while a county with a higher ADP per capita is using more jail space per resident. The BJS publishes county-level rates that make those comparisons easier, and the Vera Institute also publishes county trend reports as research context, separate from official TCJS data.
Searching for McLennan County Inmate Records by Name
The population data on this topic is aggregate, not a person-by-person lookup. For a name search of current custody, use the Sheriff's Current Inmate Listing PDF and the Mugshots Application. Both are covered in detail on the McLennan County inmate records page. For people who already moved to state or federal custody, the TDCJ offender search and the federal Bureau of Prisons locator are the right tools.
Where the Data Comes From
The two primary layers are the Sheriff's hourly inmate listing and the TCJS monthly Population Summary. The Sheriff layer answers who is in custody right now. The TCJS layer answers how full the jail is and which categories of custody are present. Because the Sheriff app exposes booking-level data and not systemwide totals, any McLennan County population claim should cite TCJS for the count and the Sheriff app for what fields are exposed to searchers. Do not infer release counts or demographic totals by scraping mugshots without disclosing the method.